EUR/GBP Price Analysis: Bears make a stride, cross in lows in over a week
- Technical indicators send signals of the bulls weakening, with the RSI in oversold territory and the MACD showing decreasing green bars.
- The 20-day SMA support is now gone.
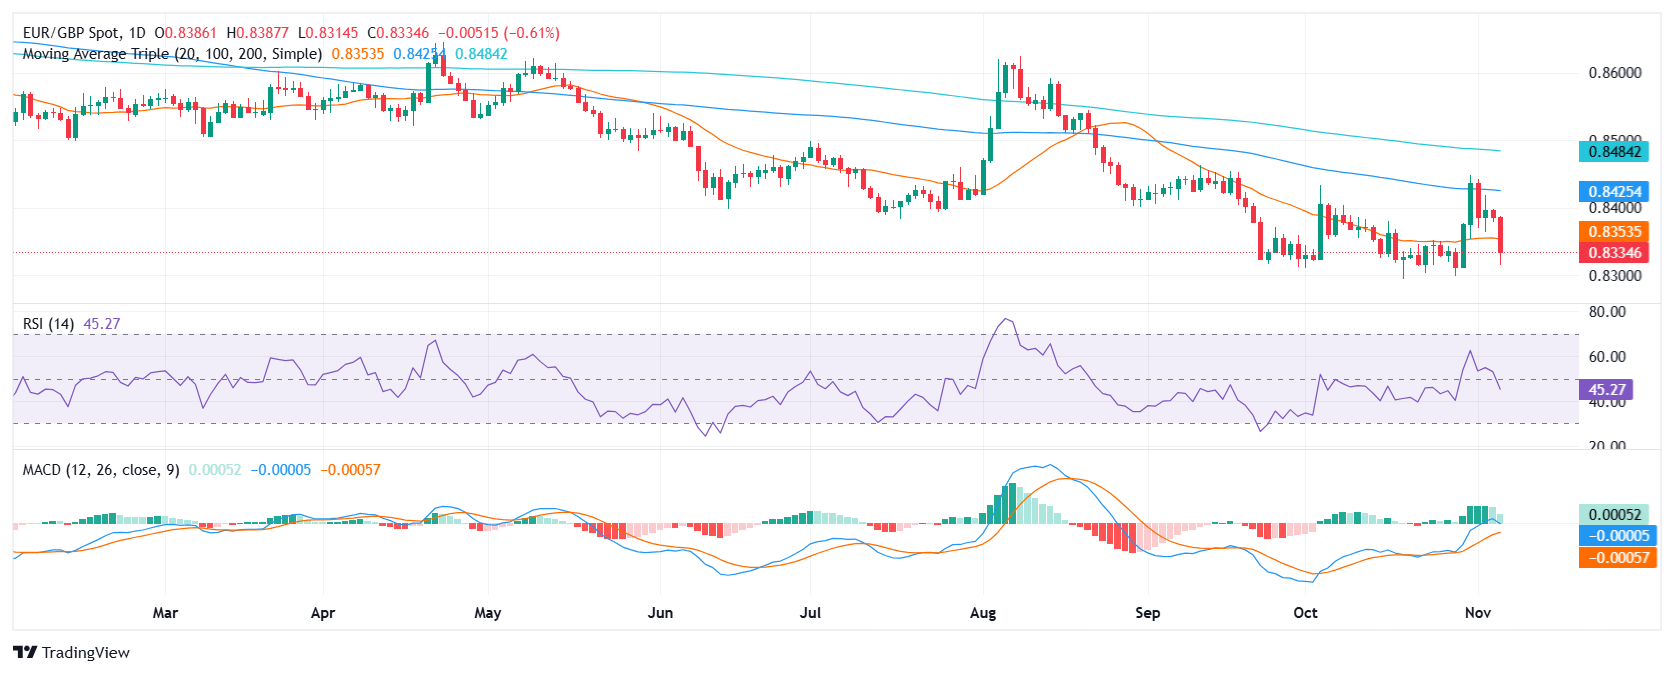
Wednesday’s EUR/GBP market has been dominated by significant losses, extending a bearish trend that has lasted the past seven trading sessions. This downward momentum has pushed the pair below its 20-day Simple Moving Average (SMA) and down to its lowest point in over a week.
Technical indicators are presenting a nuanced outlook. The Relative Strength Index (RSI), which measures the strength or weakness of price movements, has dipped into negative territory and its downward trajectory indicates a rise in selling pressure. The RSI's current value of 45 places it in the negative zone. The Moving Average Convergence Divergence (MACD), a trend-following indicator, displays decreasing green histogram bars. This suggests that buying pressure is waning.
The EUR/GBP cross plunged and lost the 20-day Simple Moving Average (SMA), indicating a potential downward trend. This decline pushed the cross to its lowest point in over a week, further suggesting a bearish sentiment. Supports now line up at 0.8330, 0.8315 and 0.8300.

