USD/JPY retreats from highs as Dollar weakens and Japan signals tariff pushback
- The pair trades near 145.00, correcting from recent highs amid renewed Dollar softness.
- NFP beats expectations at 177K, but weak ISM and GDP data revive Fed rate cut bets.
- Bearish bias persists; key resistance at 145.52 and support at 144.42 with neutral RSI and MACD.
USD/JPY pulls back toward the 145.00 area on Friday after extending gains earlier in the week. The pair loses momentum in tandem with the US Dollar, which fell below 99.50 following a firm rejection at the 100.00 level. This decline comes as markets digest mixed macro data and renewed trade headlines, including China’s signal to open tariff talks and Japan’s call for US tariff reconsideration.
April's Nonfarm Payrolls rose by 177,000, above the consensus of 130,000, yet March’s figure was revised sharply lower. The Unemployment Rate remained at 4.2%, and wage growth held steady at 3.8% year-on-year. Despite the strong headline, soft jobless claims and ISM manufacturing data, combined with a Q1 GDP contraction of -0.3%, have reinforced expectations for a potential Fed rate cut in June. The swaps market is now pricing in four cuts through year-end.
In Japan, Finance Minister Kato said UST holdings could be leveraged in US trade talks, signaling a firmer stance against tariffs. Labor market data were mixed, with unemployment ticking up to 2.5%, and job-to-applicant ratio slightly improved. Despite a relatively tight labor environment, wage growth is decelerating, and the Bank of Japan is expected to maintain its ultra-loose policy through 2025.
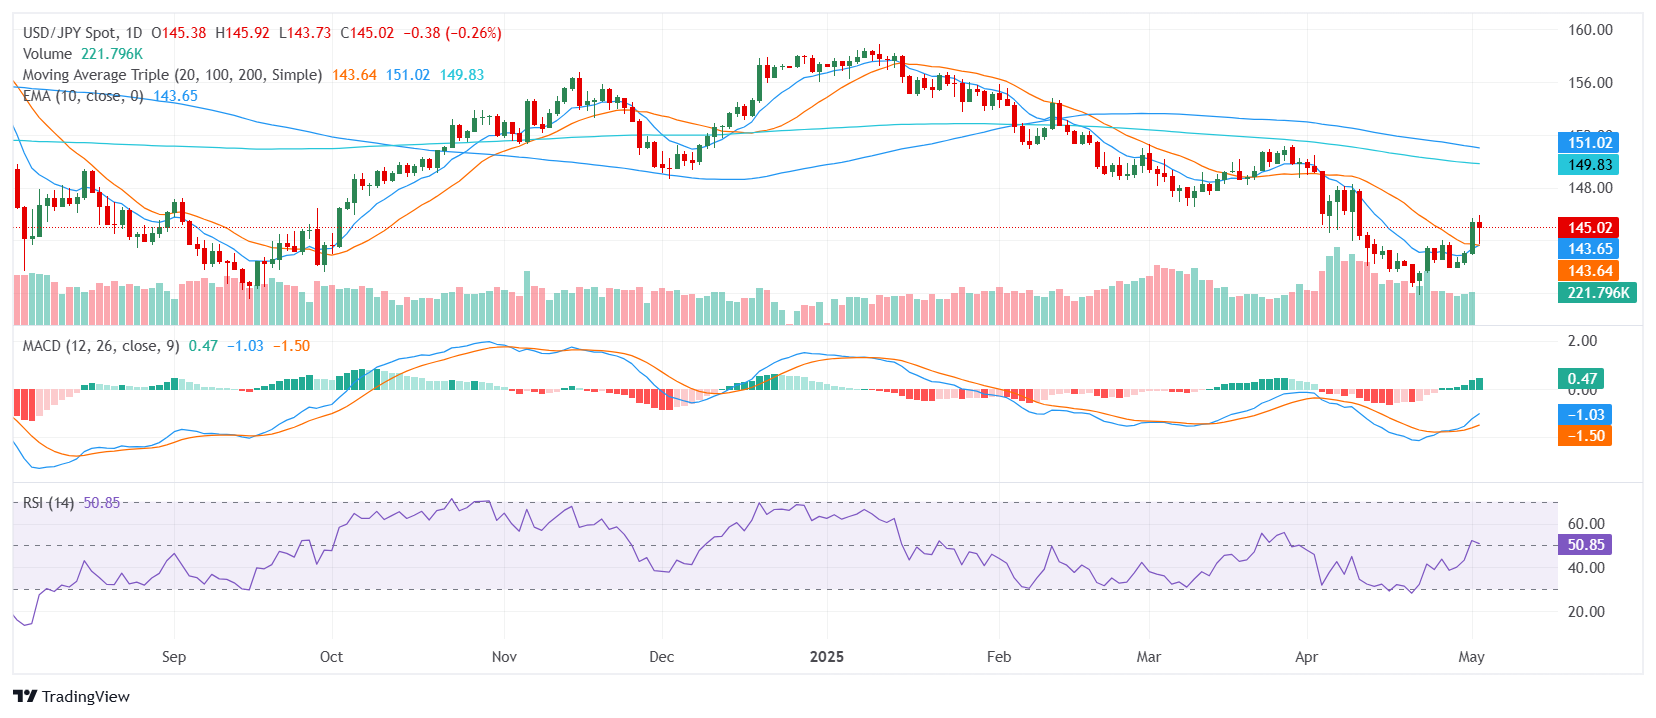
Technical Analysis
Technically, USD/JPY trades mid-range between 143.72 and 145.92, maintaining a bearish bias. The 30-day EMA at 145.02 and the 30-day SMA at 145.52 both flash sell signals. The RSI at 50.73 and MACD are neutral to slightly bullish, while the Stochastic %K near 81.82 signals caution. Near-term support is seen at 144.51, 144.42, and 144.16. Resistance levels are aligned at 145.02, 145.52, and 145.54. Long-term moving averages—100-day at 150.94 and 200-day at 149.78—continue pointing to a downtrend, with only the 20-day SMA at 143.60 suggesting limited near-term buying interest.
Daily Chart